常见的网站压测工具介绍与使用
2021-01-25
blog
blog , mysql , nginx
字数统计: 1.7k(字)
阅读时长: 7(分)
压力测试是每一个Web应用程序上线之前都需要做的一个测试,他可以帮助我们发现系统中的瓶颈问题,减少发布到生产环境后出问题的几率;预估系统的承载能力,使我们能根据其做出一些应对措施。
Apache Ab
Apache Benchmark(简称ab) 是Apache安装包中自带的压力测试工具 ,简单易用。 使用起来非常的简单和方便。 不仅仅是可以apache服务器进行网站访问压力测试,还可以对其他类型的服务器进行压力测试。 比如nginx,tomcat,IIS等
官网:http://httpd.apache.org/docs/2.2/programs/ab.html
参数说明
1
2
3
4
5
6
7
8
9
10
11
12
13
14
15
16
17
18
19
20
21
22
23
24
25
26
27
28
29
30
31
32
33
34
Usage: ab [options] [http[s]://]hostname[:port]/path 用法:ab [选项] 地址 选项: Options are: -n requests -c concurrency -t timelimit -s timeout -b windowsize -B address -p postfile -u putfile -T content-type -v verbosity -w -i -y attributes -z attributes -C attribute -H attribute -A attribute -P attribute -X proxy:port -V -k -d -q -g filename -e filename -r -h -Z ciphersuite 指定SSL/TLS密码套件 -f protocol 指定SSL/TLS协议(SSL3, TLS1, TLS1.1, TLS1.2 or ALL)
压测测试
1 ab -c 10 -n 1000 -k "http://www.baidu.com/"
1
2
3
4
5
6
7
8
9
10
11
12
13
14
15
16
17
18
19
20
21
22
23
24
25
26
27
28
29
30
31
32
33
34
35
36
37
38
39
40
41
42
43
44
45
46
47
48
49
50
51
52
53
54
55
56
This is ApacheBench, Version 2.3 <$Revision : 1430300 $> Copyright 1996 Adam Twiss, Zeus Technology Ltd, http://www.zeustech.net/ Licensed to The Apache Software Foundation, http://www.apache.org/ Benchmarking www.baidu.com (be patient) Completed 100 requests //* 已完成请求数 Completed 200 requests Completed 300 requests Completed 400 requests Completed 500 requests Completed 600 requests Completed 700 requests Completed 800 requests Completed 900 requests Completed 1000 requests Finished 1000 requests Server Software: BWS/1.1 //* 请求的服务器名称、版本号 Server Hostname: www.baidu.com //* 请求的地址 Server Port: 80 //* 请求的端口号 Document Path: / //* 请求的绝对路径,即具体接口名称 Document Length: 199875 bytes //* 响应数据的大小 Concurrency Level: 10 //* 并发用户数 Time taken for tests: 14.567 seconds //* 测试总耗时 ,单位:s Complete requests: 1000 //* 总请求数 Failed requests: 988 //* 失败总请求数 (Connect: 0, Receive: 0, Length: 988, Exceptions: 0) Write errors: 0 //* 发送请求失败的次数 Total transferred: 198476425 bytes //* 从服务端收到的总字节数 HTML transferred: 197338475 bytes //* 从服务端收到的总文档字节数,即不包含Total transferred中的HTTP头信息 Requests per second: 68.65 [#/sec] (mean) //* 平均每秒请求数,即吞吐量 Time per request: 145.672 [ms] (mean) //* 平均每次请求并发用户总耗时,即 该值=平均每次请求耗时 * 并发数 ,单位:ms Time per request: 14.567 [ms] (mean, across all concurrent requests) //* 平均每次请求耗时 ,单位:ms Transfer rate: 13305.53 [Kbytes/sec] received //* 服务端每秒响应的数据大小,单位: kb/s Connection Times (ms) //* 网络耗时 (依次是:最小、平均、标准偏差、中位数、最大) ,单位:ms min mean[+/-sd] median max Connect: 6 16 89.3 8 1011 Processing: 22 127 160.5 73 1919 Waiting: 8 23 53.5 10 499 Total: 28 143 182.4 82 1927 Percentage of the requests served within a certain time (ms) //* 请求耗时分布情况百分比 ,单位:ms 50% 82 66% 105 75% 134 80% 284 90% 321 //* 表示 90%的请求在 321ms 内得到服务端响应结果 95% 367 98% 746 99% 1038 100% 1927 (longest request)
Jmeter
Apache JMeter是Apache组织开发的基于Java的压力测试工具。用于对软件做压力测试,它最初被设计用于Web应用测试,但后来扩展到其他测试领域。
Windows 安装
Mac 安装
JavaJDK 安装
JDK安装 此处略去,不作为文本的介绍的重点,读者可自行Google。
Jmeter安装
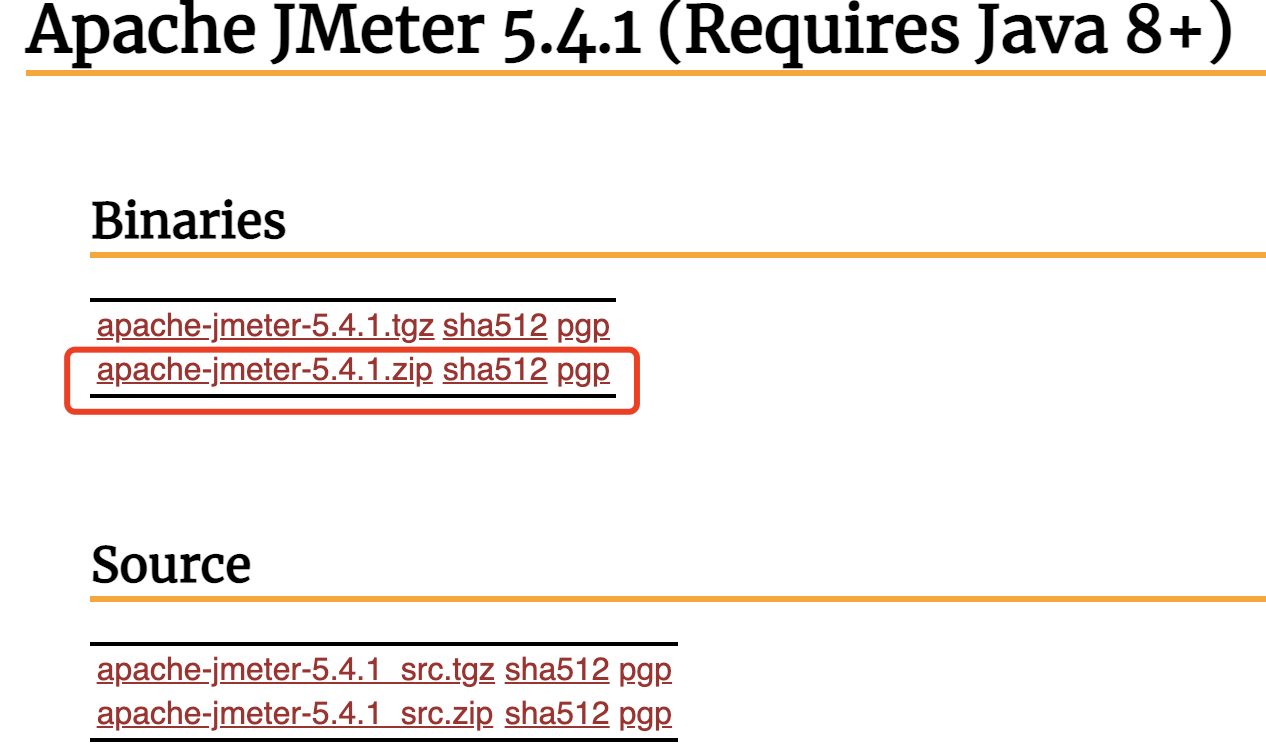
进入JMeter的下载地址 页面,如下图,有两个版本可供下载
Binaries:二进制版,即已经编译好、可直接执行;
Source:源代码版,需要自己编译;
将此软件下载后,进行解压
启动jmeter
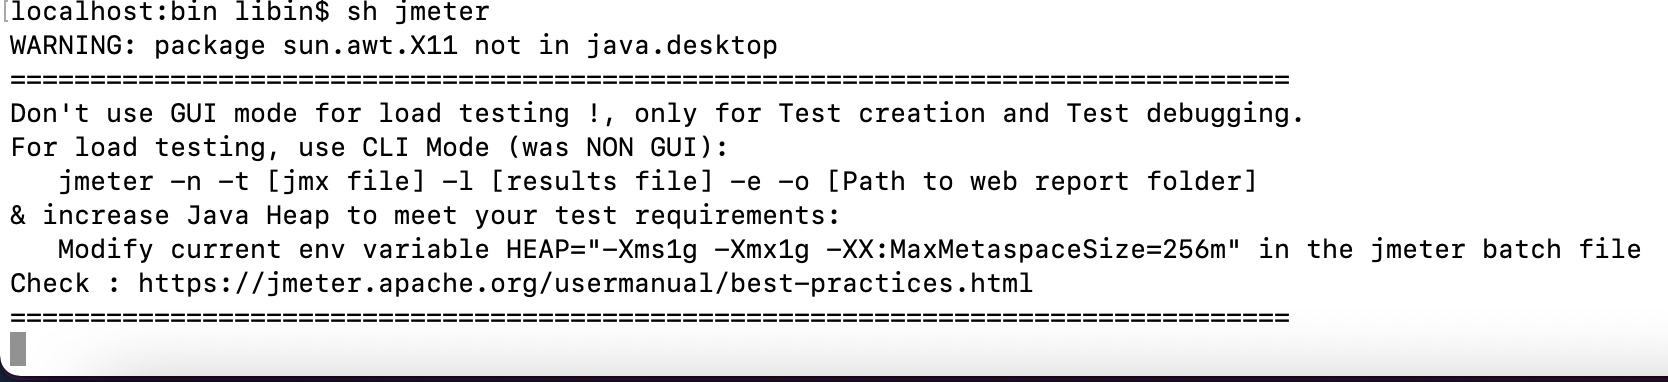
进入 jmeter 的 bin 目录,执行 sh jmeter 命令,即可启动 jmeter 软件
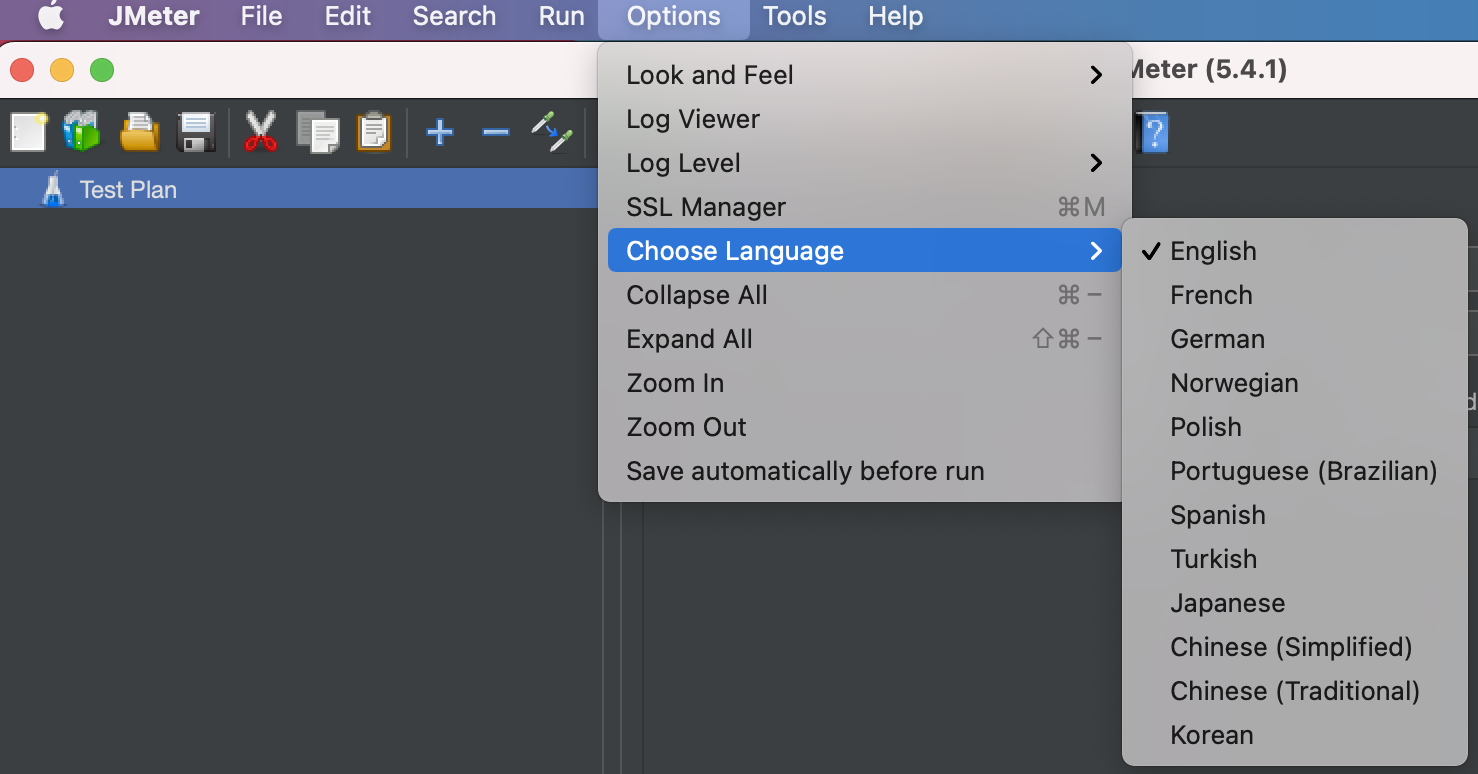
改为中文